Timeline infographic example · AI Marketing in the AI Era
A sample infographic, made with InfographicHQ from the topic “How AI is changing marketing in 2026”.
Same layout, look and colours, on your topic. Your first one is free.
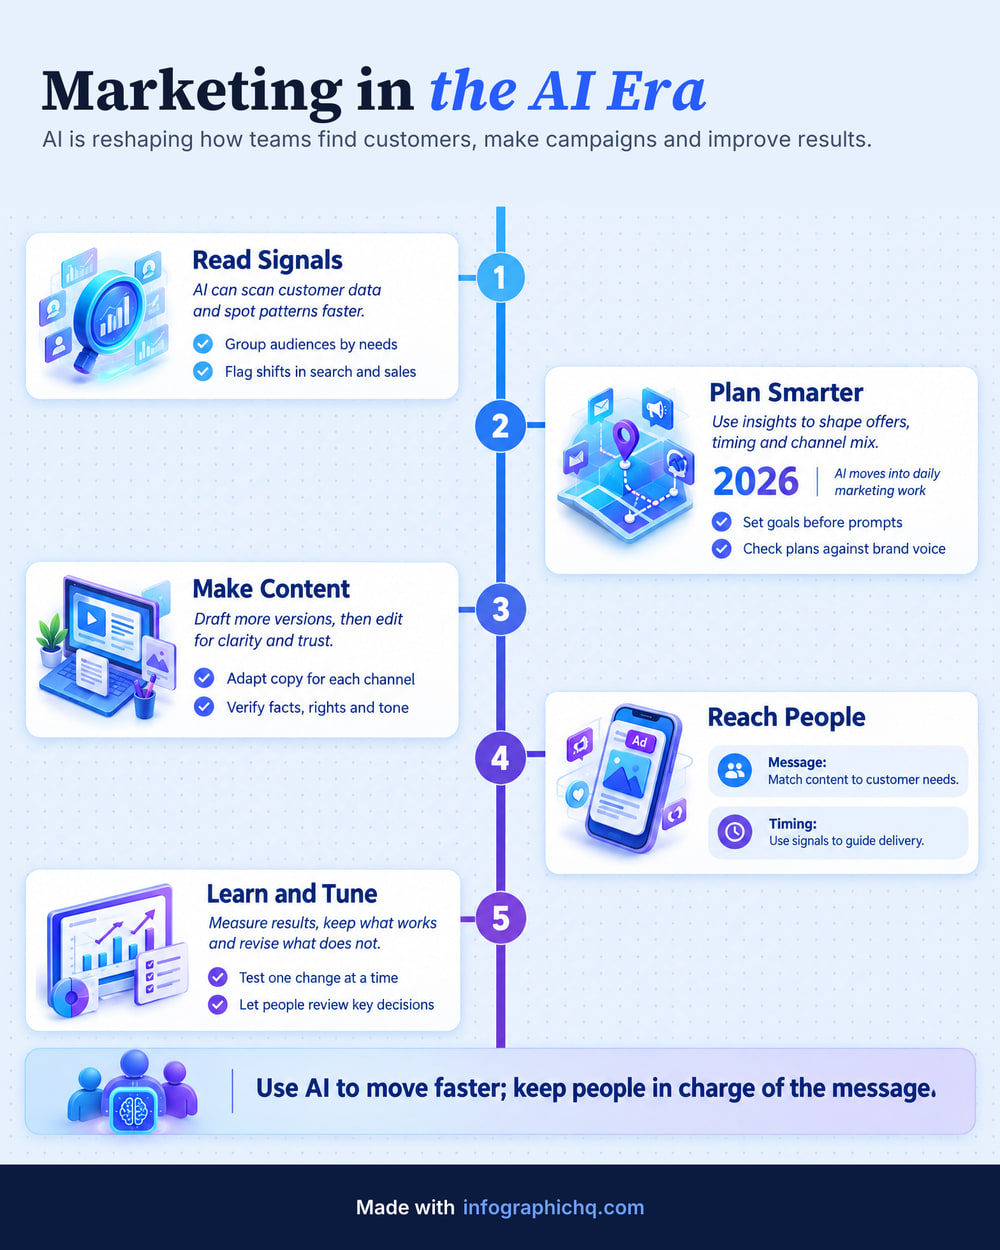
Open it full size to read it. Made with InfographicHQ, down to the words.
Why this timeline layout works
Here, the topic is a change that happens in stages, so its five steps sit in order on one line.
How this infographic was made
InfographicHQ made this timeline infographic from one typed topic.
Topic and style
- Topic typed
- How AI is changing marketing in 2026
- Layout
- Timeline
- Look
- Modern
- Pictures
- 3D
- Colours
- Blue
- Length
- Standard, 119 words
- Cards
- 5
- Shape
- Portrait 4:5
A timeline suits anything where order matters: the steps of a process, the stages of a change, a year in review. Each card is one step, and the line down the middle tells the reader which comes first. Five steps is a comfortable length.
The words in this infographic
InfographicHQ wrote these words from the topic alone.
Read the words
Read Signals
AI can scan customer data and spot patterns faster.- Group audiences by needs
- Flag shifts in search and sales
Plan Smarter
Use insights to shape offers, timing and channel mix.2026 AI moves into daily marketing work- Set goals before prompts
- Check plans against brand voice
Make Content
Draft more versions, then edit for clarity and trust.- Adapt copy for each channel
- Verify facts, rights and tone
Reach People
- Message:
- Match content to customer needs.
- Timing:
- Use signals to guide delivery.
Learn and Tune
Measure results, keep what works and revise what does not.- Test one change at a time
- Let people review key decisions
More infographic examples


Turn your topic into a finished infographic.
Get your free infographic
Yours to post on LinkedIn, with no watermark.
