Columns infographic example · Marketing One Blog Post, One Month of LinkedIn Posts
A sample infographic, made with InfographicHQ from the topic “How to turn one blog post into a month of LinkedIn posts, week by week”.
Same layout, look and colours, on your topic. Your first one is free.
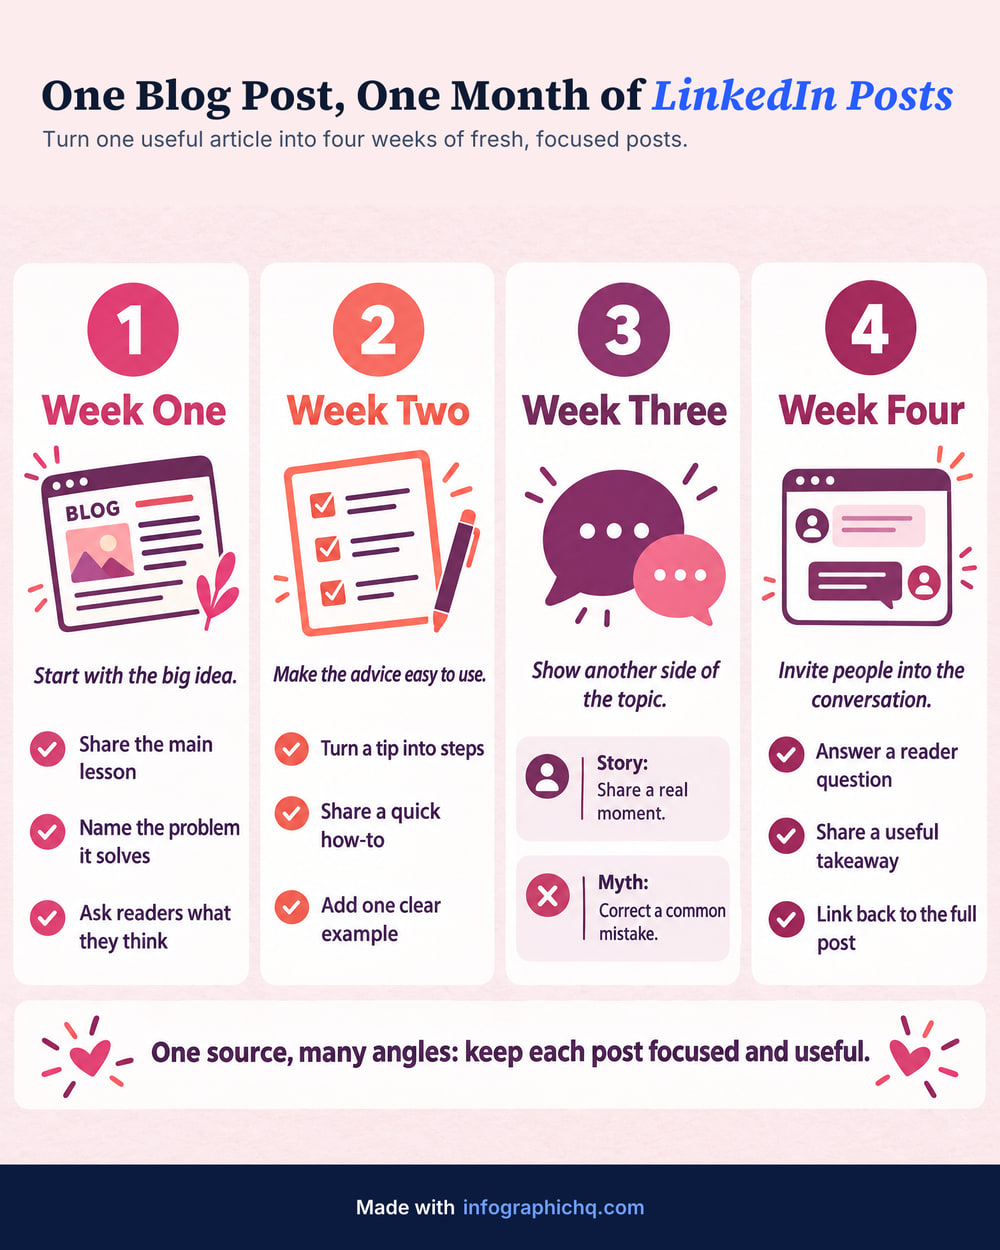
Open it full size to read it. Made with InfographicHQ, down to the words.
Why this columns layout works
Here, the four weeks are parallel and read left to right, so each week gets its own column.
How this infographic was made
InfographicHQ made this columns infographic from one typed topic.
Topic and style
- Topic typed
- How to turn one blog post into a month of LinkedIn posts, week by week
- Layout
- Columns
- Look
- Playful
- Pictures
- Flat
- Colours
- Pink
- Length
- Standard, 91 words
- Cards
- 4
- Shape
- Portrait 4:5
Columns suit a few parallel things read left to right: weeks, phases, options, team roles. Three or four is the most a phone screen holds side by side, so give each column a short heading and two or three lines.
The words in this infographic
InfographicHQ wrote these words from the topic alone.
Read the words
Week One
Start with the big idea.- Share the main lesson
- Name the problem it solves
- Ask readers what they think
Week Two
Make the advice easy to use.- Turn a tip into steps
- Share a quick how-to
- Add one clear example
Week Three
Show another side of the topic.- Story:
- Share a real moment.
- Myth:
- Correct a common mistake.
Week Four
Invite people into the conversation.- Answer a reader question
- Share a useful takeaway
- Link back to the full post
More infographic examples


Turn your topic into a finished infographic.
Get your free infographic
Yours to post on LinkedIn, with no watermark.
